PM2.5 vs NO2 vs ozone: picking a pollutant for a respiratory cohort
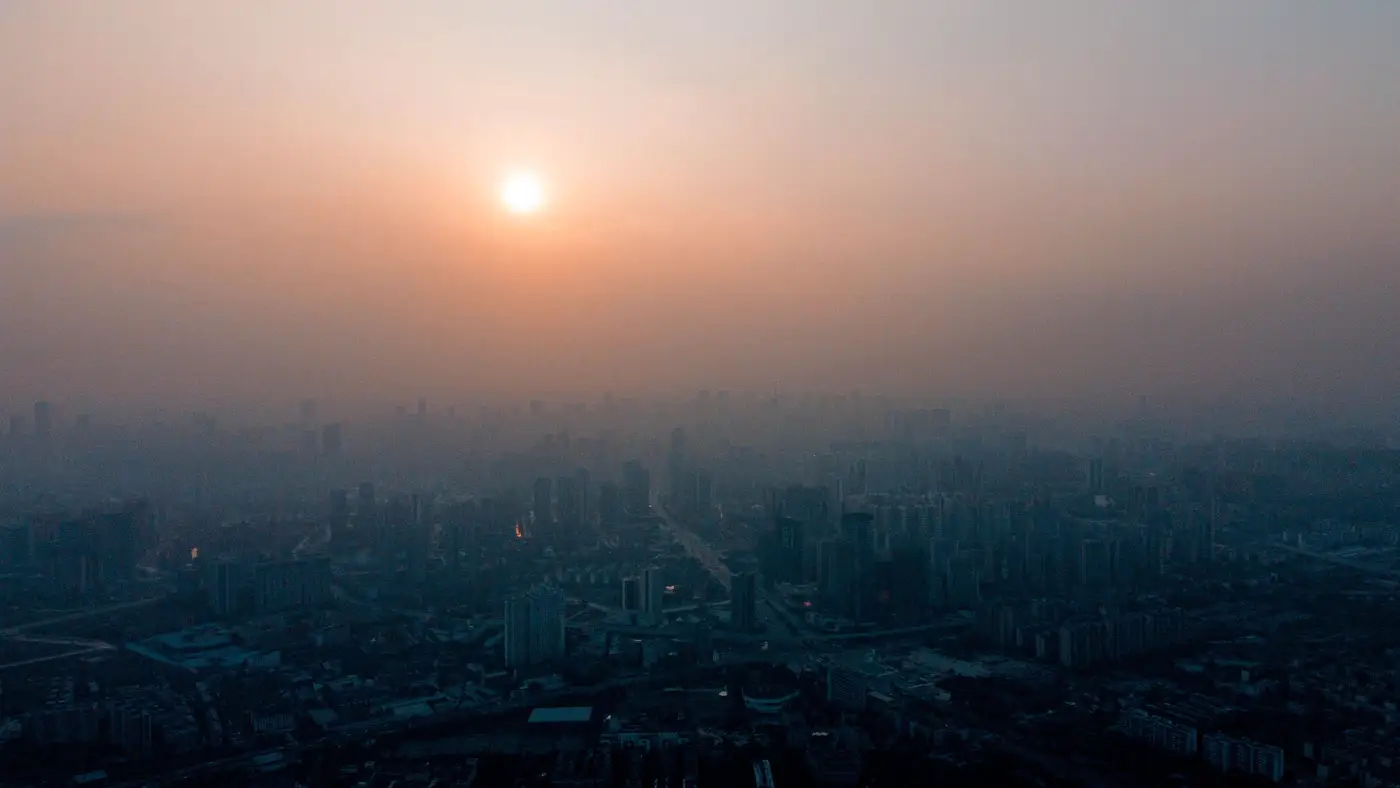
Every cohort proposal with a respiratory outcome eventually hits the same line in the methods section: which pollutant is the exposure variable. Reviewers want a justification, not just a correlation with whatever monitor data was easiest to pull. PM2.5, NO2, and ozone behave differently in the lung, differently in space, and differently in the data you can get your hands on. The choice shapes everything downstream, from the land use regression you fit to the lag structure you test.
What each pollutant tells you about respiratory risk
PM2.5 is the workhorse for asthma exacerbation and COPD cohorts because the mechanistic story is strongest and the literature is deepest. It's a mixture, not a single compound, so its composition varies by source: traffic-dominated PM2.5 behaves differently than wildfire smoke or regional sulfate. If your cohort spans a wildfire-exposed region, that heterogeneity matters more than the headline concentration.
NO2 is the better choice when your real interest is traffic proximity and you want a pollutant that tracks it tightly. It has sharp spatial gradients near roadways and drops off within a few hundred meters, which makes it useful for studies built around distance-to-road exposure but also means a coarse surface will blur exactly the contrast you're trying to capture. NO2 also doubles as a proxy for the broader traffic-related pollutant mix (black carbon, ultrafine particles) that most cohorts can't measure directly.
Ozone is the odd one out. It's a secondary pollutant, formed downwind from precursors, so it's often higher in suburban and rural areas than at the urban core where your traffic-exposed participants live. For respiratory cohorts focused on lung function decline or exercise-induced symptoms, ozone's summertime, afternoon-peaking pattern means your exposure window has to line up with activity patterns, not just residential address.
Matching the pollutant to your outcome and your data
If your outcome is pediatric asthma exacerbation, PM2.5 and NO2 both have decent evidence bases; the deciding factor is usually which one your monitor network resolves at neighborhood scale in your study area. If it's COPD progression in an older cohort with mostly fixed residential addresses, PM2.5's chronic exposure literature is more directly applicable. If you're modeling acute symptom days or spirometry visits tied to specific exposure windows, ozone's daily variability and NO2's sharp local contrast both matter, and a single-pollutant model will probably underfit.
Multi-pollutant exposure assessment is the honest answer for a lot of respiratory cohorts, but it comes with a real cost: PM2.5 and NO2 are often correlated enough in urban areas that separating their independent effects needs either a large sample, a wide spatial contrast in your cohort's residential locations, or both. Before committing to a three-pollutant model, check what your actual geographic spread of participants can support. A cohort clustered in one metro area with uniform traffic density won't have the contrast to disentangle PM2.5 from NO2 no matter how good the exposure surface is.
Criteria pollutant selection also comes down to a practical constraint reviewers rarely ask about directly: what resolution can you defend at the residential address level. A regulatory monitor eight kilometers from a participant's home is a poor stand-in for their exposure, and that gap is usually bigger for NO2 (steep gradients) than for regional PM2.5 or ozone. Distinguishing exposure between participants who live two streets apart takes a surface built at a resolution fine enough to see that difference. The nearest fixed monitor to your study area's centroid can't give you that in a dense residential grid. That's the gap Air Quality Exposure is built to close, turning daily satellite aerosol retrievals into neighborhood-resolution estimates over the footprint you define, so the exposure assignment in your model reflects where people live.
Whichever pollutant, or combination, you land on, ground the justification in the mechanism, the spatial scale of your cohort, and the resolution your exposure model can support. That holds up better in review than a methods paragraph built around which dataset happened to be free.
If per-participant resolution is the piece missing from your exposure assignment, get in touch about what Air Quality Exposure can build for your study area.