How to handle missing satellite AOD data from cloud cover
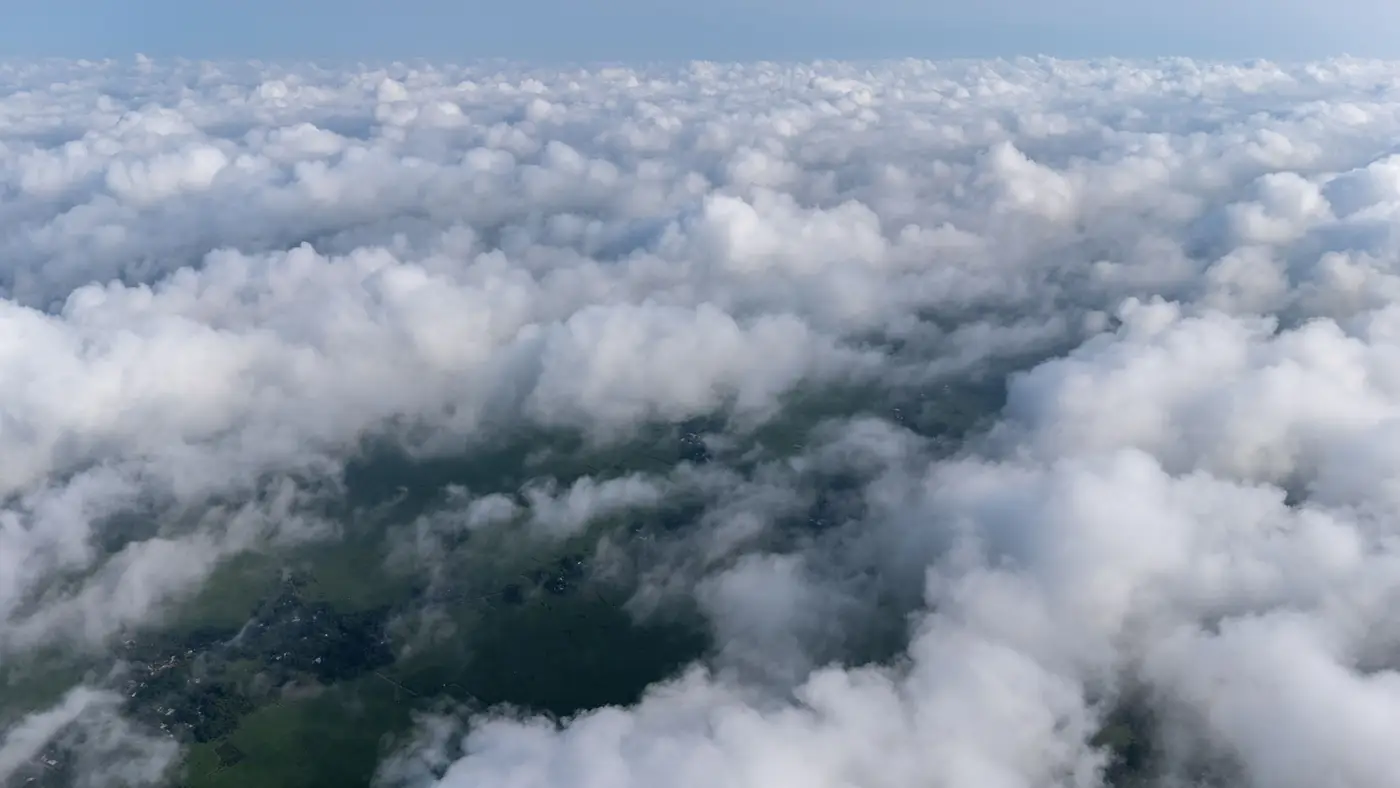
If you run exposure models off satellite AOD, you already know the uncomfortable number: in a lot of mid-latitude regions, 40 to 60 percent of days in a given season get thrown out to cloud masking before you even start your spatiotemporal model. For a cohort study where you're trying to reconstruct daily PM2.5 exposure at the residential level, that's not a rounding error. That's half your person-days with a hole in them.
This post walks through why the gaps happen, what the standard gap-filling approaches actually do (and don't do), and what it means for how you write up your exposure assessment methods section.
Why the gaps aren't random
MODIS, VIIRS, and similar instruments retrieve AOD from reflected sunlight, so a pixel under cloud, haze, or heavy smoke just doesn't produce a usable retrieval. The cloud mask algorithm (internal cloud flags, often paired with a cirrus test) screens those pixels out before the AOD product ever reaches you. Fine so far. The problem for epidemiologists specifically is that cloud cover correlates with the weather conditions that also drive ground-level pollution.
Cold fronts clear the sky and disperse particulates. Stagnant, overcast conditions trap PM near the surface and simultaneously block the satellite's view of it. That's a textbook missing-not-at-random pattern, and it means naive gap-filling can quietly bias your exposure estimates toward the clear-sky regime, usually underestimating peak exposure days.
Winter is the worst offender in a lot of study regions: more persistent cloud cover, lower sun angle, and (depending on your area) snow cover that confuses the retrieval algorithm on top of it.
What gap-filling actually does
A few approaches show up repeatedly in the exposure-assessment literature, each with a different tradeoff:
Temporal interpolation. Filling a one- or two-day gap by averaging the AOD on either side. Works fine for short, isolated gaps in a stable air mass. Falls apart across a multi-day frontal passage, because you're interpolating straight through the exact event that changed the pollution level.
Spatial smoothing or neighbor imputation. Using AOD from nearby cloud-free pixels to estimate the missing one, sometimes combined with land-use or elevation covariates. This helps with scattered cloud but does nothing when an entire region is socked in.
Multi-sensor fusion. Blending AOD from more than one satellite platform, since their overpass times and cloud masks don't always line up. You recover some additional cloud-free days this way, though you're also now managing calibration differences between sensors.
Chemical transport model (CTM) priors. Using a model like GEOS-Chem or CMAQ output as a background estimate for days with no retrieval at all, then calibrating it against your available satellite and monitor data. This is the main way people fill stretches with no satellite signal whatsoever, where temporal or spatial interpolation has nothing nearby left to draw on.
Statistical and machine-learning imputation. Random forests, Bayesian maximum entropy, or similar methods trained on the relationship between AOD, meteorology, and land-use variables on clear days, then applied to predict the missing ones. These can perform well in validation but inherit whatever bias is baked into the clear-sky training data, which circles back to the missing-not-at-random problem above.
What this means for your methods section
None of these approaches make the underlying cloud problem disappear. They each trade one kind of uncertainty for another, and reviewers in this field know it. A few things worth building into the protocol from the start:
Flag every participant-day as either a direct retrieval or a gap-filled value, and keep the gap-filling method as a variable you can stratify on later. Run a sensitivity analysis comparing your health effect estimates with and without the gap-filled days included. If your cohort spans a region with strong seasonal cloud patterns, report exposure misclassification separately by season rather than pooling it, since that's usually where the missing-not-at-random bias concentrates.
And before any of that gap-filling machinery runs, you need the daily retrieval stack itself, clipped to your actual study area rather than a statewide or national tile you then have to subset. That's the starting point Air Quality Exposure is built around: a defined daily AOD feed for a specific study area, so your gap-filling and imputation work starts from a complete, study-area-specific record rather than a patchwork of downloaded granules.
If you're scoping the exposure pipeline for a new cohort, take a look at what a daily, study-area-specific AOD feed would look like for your site.