Field notes: the week one monitor had to speak for an entire county
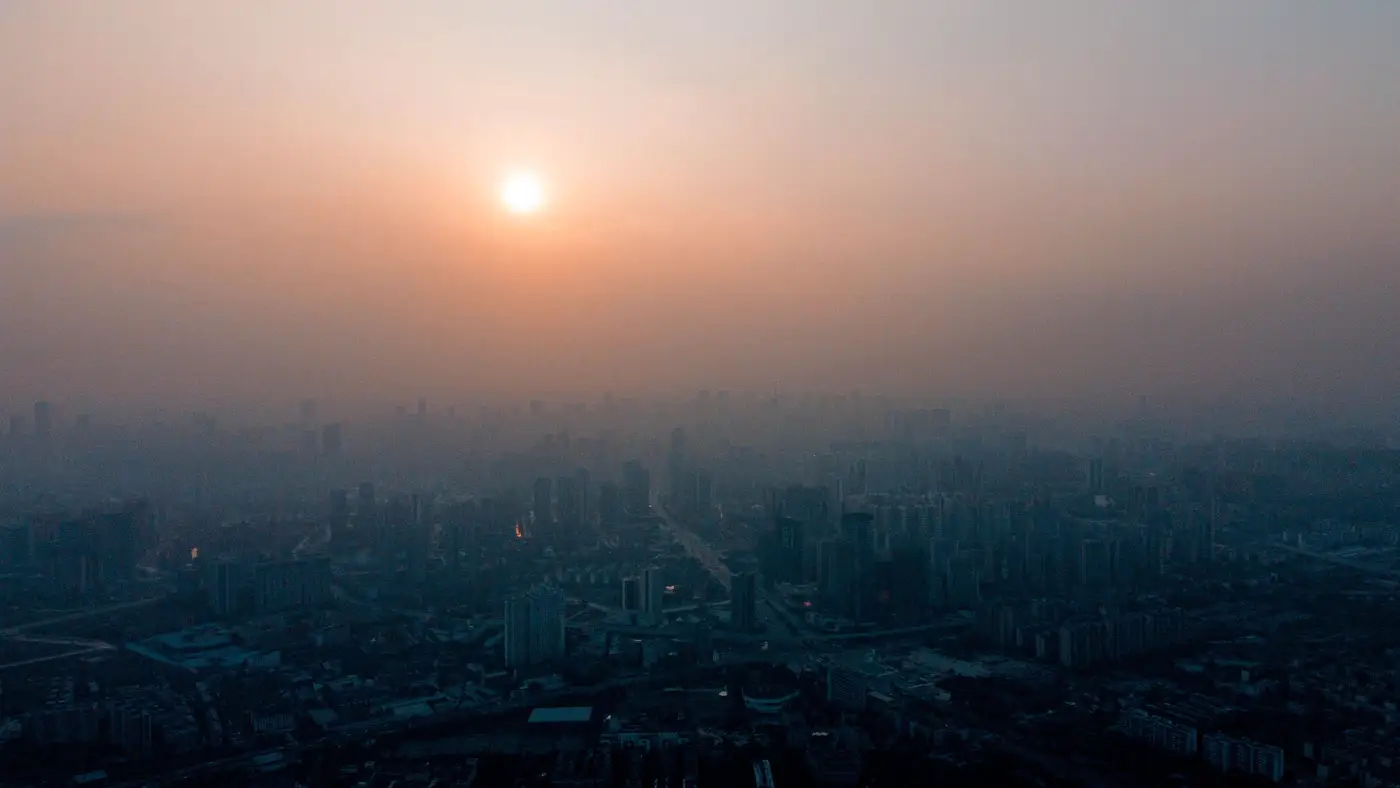
Every wildfire season produces at least one week like this. The smoke rolls in overnight, the regional haze advisory goes out, and somewhere in the county a single federal reference monitor starts doing a job it was never built for: representing exposure for everyone who lives within fifty, eighty, sometimes a hundred miles of it.
I've sat with enough of these datasets now to recognize the pattern before I even open the file. PM2.5 readings climb through the evening, hit a plateau that looks suspiciously flat for a plume that's visibly still moving on the smoke forecast maps, and then either flatline at an instrument ceiling or drop out entirely for a stretch of hours. The tech note that eventually gets added to the record says something about filter loading or a scheduled calibration. What it doesn't say, because it can't, is what the twelve ZIP codes without a monitor were breathing during that gap.
This is the part of cohort work that never makes it into the methods section cleanly. You've got your residential addresses geocoded, your enrollment dates locked, and then wildfire season hands you a week where your only ambient data point is forty miles from half your participants and offline for six hours in the middle of it. Nearest-monitor assignment, which is a defensible shortcut on an ordinary Tuesday, turns into a real source of exposure misclassification exactly when the stakes are highest. Smoke doesn't sit still to wait for your instrument. It drifts with the terrain, pools in valleys overnight, and clears unevenly as the morning inversion breaks up, often in ways a single fixed site simply cannot see.
What struck me going back through a few of these episodes is how much spatial structure gets thrown away by averaging. A county-level daily mean smoothes over the exact thing you need for a dose-response analysis: the participant two towns over who had three consecutive days above the monitor's, because the plume sat on a hillside the sensor network never reached. Fold that into a single county-wide exposure value and that participant looks identical to someone who had clean air all week. The error doesn't cancel out. It biases toward the null, and it does it quietly, which is worse.
None of this is a knock on the monitors themselves. The regulatory network does exactly what it was designed to do, which is track compliance at a handful of fixed points, not reconstruct a surface over an entire study area. The gap is structural, not a quality problem with any particular site. It's also why satellite aerosol retrievals keep coming up in conversations about cohort exposure work the way they do, because a sensor that passes over the whole county every day, smoke event or not, is answering a different question than a ground station built to flag exceedances.
The approach we've been building at Air Quality Exposure starts from that gap: daily coarse-resolution retrievals downscaled to something closer to neighborhood scale, covering the exact study footprint rather than whatever falls within reach of the nearest EPA site. It won't replace ground truth, and it shouldn't. But it gives you a second line of evidence for the weeks when the nearest monitor stopped representing anyone but itself.
If this is the gap you've been patching with distance-weighted interpolation and a few apologetic footnotes in your exposure appendix, it's worth seeing what a daily, study-area-specific retrieval looks like for your cohort.